Solusi murah untuk HRD
Bukan perkara mudah bagi manajemen untuk menentukan
seorang pegawai, diberikan bonus,
dipromosikan naik jabatan atau bahkan harus diberhentikan!. Bagi perusahaan
yang pegawainya bisa dihitung dengan jari tentu mudah, tapi bagaimana jika
pegawainya sudah ratusan atau bahkan ribuan. Tentu memerlukan bantuan
programmer untuk membuat sistimya, masalahnya tidak semua programmer mampu
membaca pattern dari lembaran dataset sebuah peristiwa.
 |
| HR globe |
Di sinilah peran seorang data scientist diperlukan untuk
mendampingi CEO/stake holder untuk memberi masukan berdasarkan analisa yang
dibuatnya, agar tidak salah dalam mengambil keputusan dalam manajemen. Tapi
mudahkah mencari data scientist? Tentu tidak mudah, andai adapun mungkin besar
salarynya.
Sekarang kita tinjau saja studi kasus HRD dengan mengambil
data dari DALEX dan menulis scriptnya dalam bahasa R. Selanjutnya untuk memudahkan
melihat hasilnya akan digunakan Shiny application yang di deploy di server shiny.io, tampilan awal untuk data mungkin agak lambat, karena penulis memakai
vasilitas server nya free, tapi jika kita sabar dan sedikit
mau menunggu, hasilnya tidak mengecewakan.
Sekilas data:
Data Human Resources department data real dalam paket DALEX.
variabel terdiri:
#gender - gender of an employee.
#age - gender of an employee in the moment of evaluation.
#hours - average number of working hours per week.
#evaluation - evaluation in the scale 2 (bad) - 5 (very good).
#level of salary in the scale 0 (lowest) - 5 (highest).
#status - target variable, either fired or promoted or ok.
#status - target variable, either fired or promoted or ok.
 |
| Gb1 |
#tail(HR)
# gender age
hours evaluation salary status
#9995 female 28.94369 49.02750 3
4 ok
#9996 female 50.17571 45.58252 5
0 promoted
#9997 female 59.08727 40.66473 3
0 fired
#9998 female 51.04930 37.81015 4 0
fired
#9999 male 36.15874 35.06233 2
3 ok
#10000 female 57.96254
54.78624 4 4 promoted
# dim(HR)
#[1] 7847 6
Berikut scriptnya:
#---UI file
library(shiny)
library(shinythemes)
library("DALEX")
library("randomForest")
library("ceterisParibus")
ui <- shinyUI(navbarPage(
theme = shinytheme("superhero"),
strong("HR-Dalex-use RF-Machine Learning"),
tabPanel("Home",
tags$head(
tags$style(HTML(".my_style_1{ margin-top: -20px; margin-left: -15px; margin-right: -15px; color: black;
background-image: url(https://www.payrollservicesllc.com/wp-content/uploads/2017/09/31821b1.jpg);
background-size: 100% auto;background-repeat: no-repeat
}"))),
class = "my_style_1",
fluidRow(
br(),br(),br(),br(),br(),br(),br(),br(),br(),br(),br(),br(),br(),br(),br(),br(),br(),br(),
br(),br(),br(),br(),br(),br(),br(),br(),br(),br(),br(),br(),br(),br(),br(),""
)
),
tabPanel("About",
tags$head(
tags$style(HTML(".my_style_1{ margin-top: -20px; margin-left: -15px; margin-right: -15px;color: black;
background-image: url(https://www.payrollservicesllc.com/wp-content/uploads/2017/09/31821b1.jpg);
background-size: 100% auto;background-repeat: no-repeat
}"))),
#https://farm1.static.flickr.com/183/468761723_0d4de9d455_b.jpg
#href="FreeVector-Water-Drop-background.jpg
#https://upload.wikimedia.org/wikipedia/commons/1/18/Karl_Pearson%2C_1910.jpg
#https://en.wikipedia.org/wiki/Statistics#/media/File:Scatterplot.jpg
#ada di http://dailypooper.com/uploads/original_photos/Article_Images/1912448032.aircrash.jpg
class = "my_style_1",
fluidPage(
fluidRow(
column(1,
"" ),
column(2,
br(),br(),
#br(),br(),br(),br(),br(),br(),br(),br(),br(),br(),br(),
h1("DALEX: Descriptive mAchine Learning EXplanations"),br(),
h4("Machine Learning models are widely used and have various applications in classification or regression tasks.
Due to increasing computational power, availability of new data sources and new methods, ML models are more
and more complex. Models created with techniques like boosting, bagging of neural networks are true black boxes.
It is hard to trace the link between input variables and model outcomes. They are use because of high performance,
but lack of interpretability is one of their weakest sides.
In many applications we need to know, understand or prove how input variables are used in the model and what impact
do they have on final model prediction. DALEX is a set of tools that help to understand how complex models are working."),
h4("----------"))
),
fluidRow(
br(),br(),br(),br(),br(),br(),br(),br(),br(),br(),br(),br(),br(),br(),br(),br(),br(),br(),""
#br(),br(),br(),br(),br(),br(),br(),br(),br(),br(),br(),br(),br(),br(),br(),""
)
)),
navbarMenu("Data",
tabPanel("About Data Boston",
mainPanel(
fluidRow(
h3(strong("HR Details")),
# p('Housing Values in Suburbs of Boston',align = 'Justify'),
p('Values are generated in a way to: -have interaction between age and gender for the fired variable',align = 'Justify'),
p('have non monotonic relation for the salary variable - have linear effects for hours and evaluation.',align = 'Justify'),
p('gender - gender of an employee.',align = 'Justify'),
p('age - gender of an employee in the moment of evaluation.',align = 'Justify'),
p('hours - average number of working hours per week.',align = 'Justify'),
p('evaluation - evaluation in the scale 2 (bad) - 5 (very good).',align = 'Justify'),
p('salary - level of salary in the scale 0 (lowest) - 5 (highest).',align = 'Justify'),
p('status - target variable, either fired or promoted or ok.',align = 'Justify')))),
tabPanel("Data Boston 1",
mainPanel(
fluidRow(
column(10,h4(strong('Data Boston')),dataTableOutput("HR")))))),
#----Model
#----------------
navbarMenu(" MODEL ",
tabPanel("b_lm_model",
mainPanel(
fluidRow(
h4("Summary Regression of Boston"),
column(10,h4(strong('Data Boston')),verbatimTextOutput("model")))))),
#-----------Explainer
navbarMenu("Explainer",
tabPanel("explainer_rf_fired",
mainPanel(
fluidRow(
h4("First we need to prepare wrappers for these models. They are in explainer_lm objects."),
column(10,h4(strong('explainer_rf_fired')),verbatimTextOutput("explainer_rf_fired"))))),
tabPanel("explainer_rf_ok",
mainPanel(
fluidRow(
h4("First we need to prepare wrappers for these models. They are in explainer_rf objects."),
column(10,h4(strong('explainer_rf_ok')),verbatimTextOutput("explainer_rf_ok"))))),
tabPanel("explainer_rf_promoted",
mainPanel(
fluidRow(
h4("First we need to prepare wrappers for these models. They are in explainer_rf objects."),
column(10,h4(strong('explainer_rf_promoted')),verbatimTextOutput("explainer_rf_promoted")))))),
#----- Ceteris Paribus
navbarMenu("Outlier detection",
tabPanel("pcpe",
mainPanel(
fluidRow(
h4("Multiclass Ceteris Paribus package can plot many explainers in a single panel. This will be useful for multiclass
classification. You can simply create an explainer for each class and plot all these explainers together"),
column(10,h4(strong('pcpe')),plotOutput("pcpe")))))),
#----Individial curves
navbarMenu("Individial curves",
tabPanel("cp_rf_fired",
mainPanel(
fluidRow(
h4("The explainer_rf_fired explainer is focused on class fired. Let’s see Ceteris Paribus profiles for first 10 individuals.
They are colored with the gender variable. It’s useful since in the model there is an interaction between age and gender. Can you spot it?"),
column(10,h4(strong('cp_rf_fired')),verbatimTextOutput("cp_rf_fired"))))),
tabPanel("pcpf10",
mainPanel(
fluidRow(
column(10,h4(strong('pcpf10')),plotOutput("pcpf10")))))),
#-------Partial Dependency Plots
navbarMenu("Partial Dependency Plots",
tabPanel("Partial Dependency Plots",
mainPanel(
fluidRow(
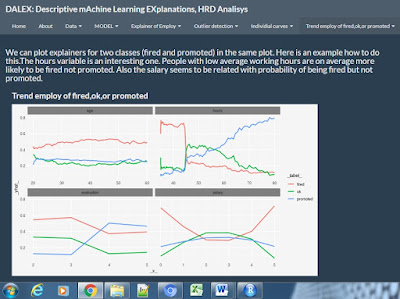
h4("We can plot explainers for two classes (fired and promoted) in the same plot. Here is an example how
to do this.The hours variable is an interesting one. People with low average working hours are on average more
likely to be fired not promoted. Also the salary seems to be related with probability of being fired but not promoted."),
column(10,h4(strong("mp_lm")),plotOutput("pcpf100")))))),
#-----Partial Dependency Plots for groups of obervations
navbarMenu("Partial Dependency Plots for groups of obervations",
tabPanel("pcpe_m_f",
mainPanel(
fluidRow(
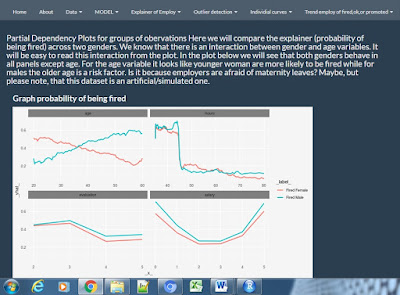
h4("Partial Dependency Plots for groups of obervations
Here we will compare the explainer (probability of being fired) across two genders. We know that there is an
interaction between gender and age variables. It will be easy to read this interaction from the plot.
In the plot below we will see that both genders behave in all panels except age. For the age variable it looks
like younger woman are more likely to be fired while for males the older age is a risk factor.
Is it because employers are afraid of maternity leaves? Maybe, but please note, that this dataset is an
artificial/simulated one."),
column(10,h4(strong("pcpe_m_f")),plotOutput("pcpe_m_f"))))))
))
#---Server file
library(shiny)
library(shinythemes)
library("DALEX")
library("randomForest")
library("ceterisParibus")
data(HR)
HR
#dim(HR)
#[1] 7847 6
## gender age hours evaluation salary status
## 1 male 32.58267 41.88626 3 1 fired
## 2 female 41.21104 36.34339 2 5 fired
## 3 male 37.70516 36.81718 3 0 fired
## 4 female 30.06051 38.96032 3 2 fired
## 5 male 21.10283 62.15464 5 3 promoted
## 6 male 40.11812 69.53973 2 0 fired
#Here we create a random forest model for this dataset.
set.seed(59)
#-------Model
model <- randomForest(status ~ gender + age + hours + evaluation + salary, data = HR)
model
#----Explain
#By default the predict.randomForest() function returns classes not scores. This is why we use user-specific #predict#() function. Here we use two explainers, one will explainer the fired class while the second will take #care #about the promoted class.
pred1 <- function(m, x) predict(m, x, type = "prob")[,1]
pred2 <- function(m, x) predict(m, x, type = "prob")[,2]
pred3 <- function(m, x) predict(m, x, type = "prob")[,3]
explainer_rf_fired <- explain(model, data = HR[,1:5],
y = HR$status == "fired",
predict_function = pred1, label = "fired")
explainer_rf_fired
explainer_rf_ok <- explain(model, data = HR[,1:5],
y = HR$status == "ok",
predict_function = pred2, label = "ok")
explainer_rf_ok
explainer_rf_promoted <- explain(model, data = HR[,1:5],
y = HR$status == "promoted",
predict_function = pred3, label = "promoted")
explainer_rf_promoted
#-----Ceteris Paribus
#Multiclass
#Ceteris Paribus package can plot many explainers in a single panel. This will be useful for multiclass classific#ati#on. You can simply create an explainer for each class and plot all these explainers together.
cp_rf1 <- ceteris_paribus(explainer_rf_fired, HR[1,])
cp_rf2 <- ceteris_paribus(explainer_rf_ok, HR[1,])
cp_rf3 <- ceteris_paribus(explainer_rf_promoted, HR[1,])
pcpe <- plot(cp_rf1, cp_rf2, cp_rf3,
alpha = 0.5, color = "_label_", size_points = 4)
pcpe
#---------Individial curves
#The explainer_rf_fired explainer is focused on class fired. Let’s see Ceteris Paribus profiles for first 10 #individuals.
#They are colored with the gender variable. It’s useful since in the model there is an interaction between age #and #gender. Can you spot it?
cp_rf_fired <- ceteris_paribus(explainer_rf_fired, HR[1:10,])
cp_rf_fired
#cp_rf_fired5 <- ceteris_paribus(explainer_rf_fired, HR[1:5,])
pcpf10 <- plot(cp_rf_fired, color = "gender")
pcpf10
#---------Partial Dependency Plots
#We can plot explainers for two classes (fired and promoted) in the same plot. Here is an example how
#to do this.The hours variable is an interesting one. People with low average working hours are on average more
#likely to be fired not promoted. Also the salary seems to be related with probability of being fired but not #promoted.
cp_rf1 <- ceteris_paribus(explainer_rf_fired, HR[1:100,])
cp_rf2 <- ceteris_paribus(explainer_rf_ok, HR[1:100,])
cp_rf3 <- ceteris_paribus(explainer_rf_promoted, HR[1:100,])
pcpf100 <- plot(cp_rf1, cp_rf2, cp_rf3,
aggregate_profiles = mean,
alpha = 1, show_observations = FALSE, color = "_label_")
pcpf100
#Partial Dependency Plots for groups of obervations
#Here we will compare the explainer (probability of being fired) across two genders. We know that there is an #interaction between gender and age variables. It will be easy to read this interaction from the plot.
#In the plot below we will see that both genders behave in all panels except age. For the age variable it looks #like #younger woman are more likely to be fired while for males the older age is a risk factor.
#Is it because employers are afraid of maternity leaves? Maybe, but please note, that this dataset is an #artificial#/simulated one.
cp_rfF <- ceteris_paribus(explainer_rf_fired,
HR[which(HR$gender == "female")[1:100],])
cp_rfF$`_label_` = "Fired Female"
cp_rfM <- ceteris_paribus(explainer_rf_fired,
HR[which(HR$gender == "male")[1:100],])
cp_rfM$`_label_` = "Fired Male"
pcpe_m_f <- plot(cp_rfM, cp_rfF,
aggregate_profiles = mean,
alpha = 1, show_observations = FALSE, color = "_label_")
pcpe_m_f
library(shiny)
library(shinythemes)
library("DALEX")
library("randomForest")
library("ceterisParibus")
server <- shinyServer(function(input,output,session){
output$HR <- renderDataTable({HR}, options = list(aLengthMenu = c(30,40,50), iDisplayLength = 50))
#output$d1 <- renderDataTable({d1}, options = list(aLengthMenu = c(5, 30, 50), iDisplayLength = 5))
#output$d2 <- renderDataTable({d2}, options = list(aLengthMenu = c(5, 30, 50), iDisplayLength = 5))
#---MODEL
output$model <- renderPrint({model})
#---Explainer
output$explainer_rf_fired <- renderPrint({explainer_rf_fired})
output$explainer_rf_ok <- renderPrint({explainer_rf_ok})
output$explainer_rf_promoted <- renderPrint({explainer_rf_promoted})
#---cp
output$pcpe <- renderPlot({pcpe})
#---Individual curve
output$cp_rf_fired <- renderPrint({cp_rf_fired})
output$pcpf10 <- renderPlot({pcpf10})
#--PDP
output$pcpf100 <- renderPlot({pcpf100})
#---PDP group
output$pcpe_m_f <- renderPlot({pcpe_m_f})
})
#---End of script
Kesimpulan:
- Lihat table umur pada Gb1, terjadi kesamaan pada unsia sekitar 35 th, laki2 dan perempuan punya posisi yang sama, sementara dengan bertambahnya usia, pegawai laki2 probabilitas berhentinya lebih besar dari pada pegawai wanita.
- Lihat table jam kerja Gb2.(hour), ada 3 kelompok, pertama pada rentang lama jam kerja kurang dari 45 jam/minggu, laki2 probabilitasnya berhenti lebih banyak daripada perempuan, kedua pada rentang jam kerja antara 45 sampai 60 jam/minggu berubah pegawai wanita lebih banyak berhenti, ketiga pada rentang jam kerja lebih dari 60 jam per minggu, berubah lagi laki laki lebih banyak berhenti.
- Bagi manajemen dengan melihat grafik tsb akan lebih mudah memebrikan treatmen atau perlakuan terhadap masinmg2 pegawai dengan tepat, berdasarkan kemampuan jam kerja per minggunya.
- Dengan melihat table yang lain akan bisa disimpulkan dari apa yang tersirat dalam pattern dataset tsb.
Referensi:
1.http://shiny.rstudio.com/
2.https://www.getapp.com/hr-employee-management-software/human-resources/
3.https://economictimes.indiatimes.com/definition/ceteris-paribus
4.https://github.com
2.https://www.getapp.com/hr-employee-management-software/human-resources/
3.https://economictimes.indiatimes.com/definition/ceteris-paribus
4.https://github.com


Tidak ada komentar:
Posting Komentar