Breakdown - Model Agnostic Explainers untuk Prediksi Individual
Paket breakDown adalah alat model agnostik untuk dekomposisi prediksi dari black box.
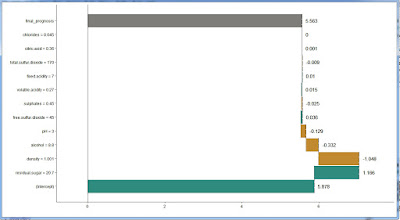
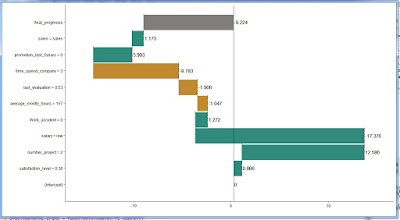
Tabel Break Down menunjukkan kontribusi setiap variabel terhadap prediksi akhir. Break Down Plot menyajikan grafis yang simple.
Paket ini cocok untuk biner classification dengan model regresi.
#---1. Model Regresi Linier
library(breakdown)
library(ggplot2)
url <- 'https://archive.ics.uci.edu/ml/machine-learning-databases/wine-quality/winequality-white.csv'
wine <- read.table(url, header = T, sep=";")
head(wine,3)
# fixed.acidity volatile.acidity citric.acid residual.sugar chlorides free.sulfur.dioxide total.sulfur.dioxide density pH sulphates alcohol quality
#1 7.0 0.27 0.36 20.7 0.045 45 170 1.0010 3.00 0.45 8.8 6
#2 6.3 0.30 0.34 1.6 0.049 14 132 0.9940 3.30 0.49 9.5 6
#3 8.1 0.28 0.40 6.9 0.050 30 97 0.9951 3.26 0.44 10.1 6
model <- lm(quality ~ fixed.acidity + volatile.acidity + citric.acid + residual.sugar + chlorides + free.sulfur.dioxide + total.sulfur.dioxide +
density + pH + sulphates + alcohol,data = wine)
new_observation <- wine[1,]
br <- broken(model, new_observation)
br
## contribution
## (Intercept) 5.90000
## residual.sugar = 20.7 1.20000
## density = 1.001 -1.00000
## alcohol = 8.8 -0.33000
## pH = 3 -0.13000
## free.sulfur.dioxide = 45 0.03600
## sulphates = 0.45 -0.02500
## volatile.acidity = 0.27 0.01500
## fixed.acidity = 7 0.00950
## total.sulfur.dioxide = 170 -0.00900
## citric.acid = 0.36 0.00057
## chlorides = 0.045 0.00019
## final_prognosis 5.60000
plot(br)
 |
| Linier Regressi |
 |
| Logistic Regresi |
#---2. Model Regresi Logistic
data("HR_data")
head(HR_data,3)
# satisfaction_level last_evaluation number_project average_montly_hours time_spend_company Work_accident left promotion_last_5years sales salary
#1 0.38 0.53 2 157 3 0 1 0 sales low
#2 0.80 0.86 5 262 6 0 1 0 sales medium
#3 0.11 0.88 7 272 4 0 1 0 sales medium
model <- glm(left~.,data=HR_data,family = "binomial")
explain1 <- broken(model,HR_data[1,], baseline = "intercept")


Breakdown model, membuat analisa lebih detail.
BalasHapus